
Client 1: Current Assumptions
- Financial Assets: $5 million. (Quick Note: The actual dollar amount here is meaningless. What matters is the amount withdrawn from the portfolio annually, aka the withdrawal rate. For example, a client with $10 million that withdraws $300k is identical to a client with $2 million and withdraws $60k for planning purposes. Both withdraw 3%/year. However, speaking in withdrawal rates is less intuitive, so I’ll be using actual dollar amounts to approximate this type of client.)
- Spends $175k/year (all spending adjusts with inflation).
- Social Security is $40k/year, so today we’re withdrawing $135k/year from the portfolio.
- 30-year retirement
Spending here is low relative to their assets, or a 2.7% ($135k/$5 million) withdrawal rate. In a Moderate portfolio, there are 0 scenarios in which this client runs out of money, aka 100% probability of success (in MoneyGuidePro it will only go to 99%). We have several clients in this situation, and this plan tells us that they are leaving a lot on the table. So how can we make this plan “better.”
Making the Plan “Better”
In a research report called “Redefining the Optimal Retirement Income Strategy,” author David Blanchett says that retirees are generally comfortable cutting their spending by about 20% before experiencing significant discomfort. Only 15% of the 1,500 participants involved said that a cut of that magnitude would cause substantial lifestyle impacts.
Before moving on let’s define core and flexible spending. It is not “needs” and “wants.” The core should be what you need for a comfortable, enjoyable lifestyle where you continue to do many of the things you enjoy doing already. The table below is a rough outline of what goes in each “bucket.”
| Core Spending | Flexible or Discretionary Spending |
| Bills (Mortgage/Rent, Utilities, Health Insurance, Transportation) | Lavish Vacations (e.g., Luxury Resorts, First Class) |
| Groceries and Household Essentials | High-End Renovations (e.g., Gourmet Kitchen Upgrade) |
| Dining Out (Casual Restaurants) | Designer Clothing and Accessories |
| Basic Clothing and Footwear | Plastic Surgery or Elective Cosmetic Procedures |
| Entertainment Subscriptions (Netflix, Spotify) | Luxury Car Upgrades or Expensive Leases |
| Home Maintenance | Lavish Gifts (e.g., Watches, Jewelry, Exclusive Art) |
| Gym Membership or Basic Fitness | Fine Dining and Michelin Star Restaurants |
| Gifts for Family and Friends (Moderate) | Season Tickets to Exclusive Events or Box Seats |
| Local Activities (e.g., Movies, Parks) | Custom Landscaping with Pools, Outdoor Kitchens |
| Routine Personal Care (e.g., Haircuts, Manicures) | Personal Trainer and Private Fitness Classes |
| Modest Travel (e.g., Family Road Trips) | Spa Retreats or High-End Wellness Vacations |
| Private Jets or Yacht Rentals | |
| Generous Charitable Donations or Sponsored Events | |
| Private Concerts or Special Experiences |
Going back to the case study, this plan has a 100% probability of success, meaning no plans fail and there’s room to spare. A starting point would be to find how much of the client’s assets are needed to get down to a high, but below 100% probability of success. We would do so by essentially “pretending” some assets no longer exist. Let’s choose 95% probability of success as the target as we want to essentially guarantee we won’t overspend and run out of money.
Using Moderate benchmark returns, we find that about $1.66 million dollars or 33% of financial assets could “disappear” and still maintain a probability of success of around 95%. Said another way, if this client continued their current rate of spending, but they only had $3.33 million (as opposed to $5 million), they’d still have a 95% probability of success. Once we capture this amount, we can take those assets and invest them aggressively in Enhanced Growth and earmark them for heirs or charity in what we’ll call the “legacy bucket.”
Next, we want to build our flexible spending bucket. At 95% probability of success, the current $175k of spending is essentially guaranteed. To assess the flexible amount, we will increase spending until we reach a probability of success of 50%. Recall from Part 4 that 50% implies the amount you can spend if returns are what we assume. Otherwise, there is a 50% chance you’ll have to adjust spending if they are worse than we assume, which we can do in real time.
Running the numbers, we find that by spending about an additional $55k on top of the $175k we currently spend, we get the plan to a 50% probability of success. Keep in mind, this $55k is flexible, and would be reduced if returns dictated it. Also, if the flexible spending amount seems too high in relation to fixed spending, we can decrease the flexible spending amount and increase the legacy goal, or vice versa.
Let’s recap to make sure we’re clear on what we did. We “gave away” $1.66 million, pretending it can’t be used anymore (although it’s of course always there), then we increased spending by nearly 31%, and the plan is still at 50% probability of success, which we are comfortable with.
The present value of each of these buckets are shown below:
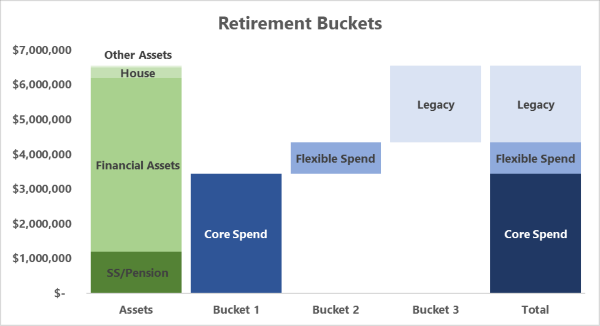 The green bar shows all assets, including Social Security or a pension, which pays for some of the core spending. It also includes a house and any other assets that won’t be used for spending but are assumed to be inherited at death.
In blue are the present values of each bucket, with the total at the end matching the assets.
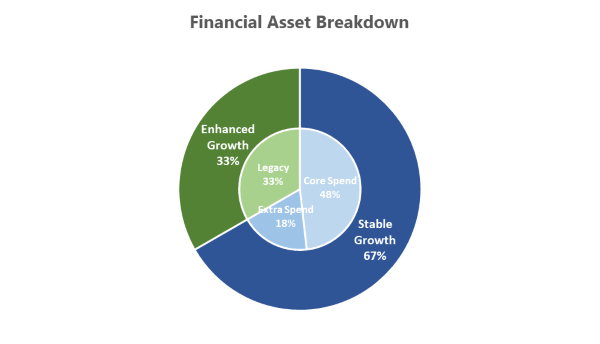
We show 3 buckets, but to simplify, we’d combine the two spending goals into one portfolio. In most cases this would be the Conservative or Moderate portfolio. This is an approximate blend of the core assets being invested in bonds, and the flexible assets being invested in a blended portfolio.
The legacy would then be invested in Enhanced Growth. The donut chart below shows the retirement buckets in the middle, with the corresponding portfolio allocations around it.
 Results:
Let’s run a Monte Carlo Simulation using all of the spending and legacy goals we’ve created. But first, in most cases today, 100% of this client’s assets would be in our Moderate portfolio. Here are the results:
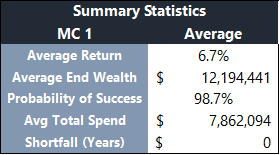 Pretty good! Now let’s see what happens if we bucket the investments as in the pie chart above:
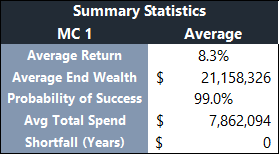 The probability of success stays about the same, but average ending wealth increases by about $9 million! That extra money could do a lot of good for either your family or charity!
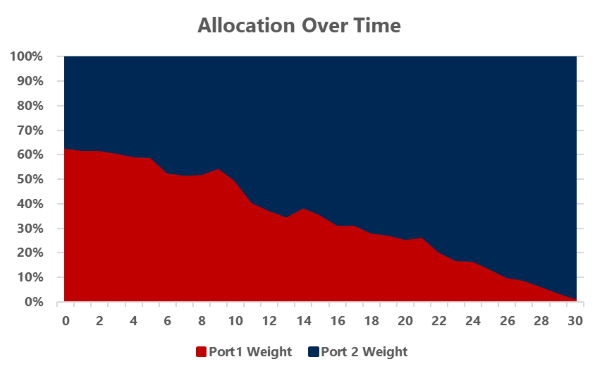
This scenario starts with a very similar allocation than what the client already had. The combined stock allocation of the two portfolios is 62% vs. 60% to for only the Moderate. So often, there doesn’t need to be a major investment change at the beginning. However, the stock allocation will grow over time, but the probability of success is unaffected because your spending is mostly insulated from the volatility of the stock market, reducing sequence of returns risk.
Client 2: Current Assumptions
- Financial Assets $2 million.
- Spends $140k/year.
- Social Security $40k/year, so today we’re withdrawing $100k/year from the portfolio.
- 30-year retirement
This client has a higher withdrawal rate (5%) and won’t have the flexibility of the first client. Their current plan is around 75% probability of success.
Since we are already below 95%, we can’t create a legacy portfolio the way we did before, but we can find an amount of spending that is essentially, guaranteed. To do this, we must lower spending until we hit a 95% probability of success.
We find that withdrawing about $80k, 20% less than what we want to spend, gets us to 95% which is essentially guaranteed.
From here, we want to find the amount of spending that would give us a 50% probability of success. All of this additional spending is “flexible” and will adjust with the market.
Solving for this amount gives us $34k of additional flexible spending. So altogether, total spending is the core portion of $80k plus $40k from Social Security, plus $34k flexible spending, which equates to about $154k. That’s a 10% increase in overall spending from the start, though the flexible portion (21% of all spending) may need to be adjusted if returns are poor.
Below are the buckets.  Like the last client, we add in a house and other assets. A couple things to contrast from client 1. First, Social Security is a more significant portion of total assets and covers a large portion of overall core spending.
Second, there is still a legacy bucket, however it only includes the house and “other assets.” There is no legacy bucket being funded from financial assets.
Here is the portfolio. Notice that there is only one portfolio instead of two in the first case: Results:
Like in the previous case study, we’ll run this plan with all assets in the Moderate portfolio. As you’d expect, the plan is around 50% probability because that’s what we solved for maximize spending. This plan is essentially done.
Depending on the client, however, we could make it a little better simply by separating some of the stock into its own bucket to avoid sequence of return risk, as we discussed in Part 3. The difference is that it’s possible this client will need to spend this money far into the future, so it’s not necessarily a “legacy” bucket, it’s more of a “avoid sequence of return risk” bucket. We are just separating so it won’t be drawn on in the first decades of the plan.
There’s a few ways to figure out how large the legacy bucket can be. A simple approach could be to combine a Conservative portfolio with the Enhanced Growth portfolio, such that the overall allocation is the same as the Moderate. Doing so would roughly result in a split like below: And the results are as follows:
 Not only have we increased our probability of success to nearly 65% (from 50%), but we’re also averaging much more ending wealth than before.
The caveat is that around year 15-20, you’ll have likely spent all of the conservative portfolio down and will be living on the stock portfolio after that point. Though the average ending wealth is much higher, it will vary quite a bit more than the balanced portfolio.
This is an aggressive approach which is fine on paper but could lead to behavioral issues down the road due to the added volatility. For that reason, we might lower the size of the Enhanced Growth portfolio for most clients such that they won’t need it for 25-30 years. It’s dependent on the client. The key point is that separating some of the stocks increases the probability of success, despite the stock allocation growing over time.
How the Plan Changes Over Time
Like always, these plans aren’t "set it and forget it." The market will change, and your preferences will change, so the plan will change with it. It won’t always be so mechanical, and we can adjust based on unique preferences and situations…but this is a good base case to start with.
When we update plans, we will check to see how much of your “flexible spending” was actually spent. If you spent it all, great! If not, we can start giving some of that extra spending away now, essentially advancing some of the legacy goal, or we can reduce the overall size of that spending goal, resulting in a larger legacy goal.
Regarding the legacy goal, it’s assumed to be a big pile of money at the end of your plan, but this could be advanced at any time. You could donate it now for tax purposes, or simply to see how it benefits others while you’re still alive. Same with family. If you have a family member that is struggling, they might prefer to see some of that money today vs. at your death.
Regardless of the specifics, the main takeaway is that every dollar is being accounted for, has a purpose, and is invested as such.
Final Part Preview
The series is almost over but we have one part remaining. Up till now, the goal has been to introduce the issues with current methods of retirement planning and explain the strategies and concepts to improve them. This piece was intended to show how it could be applied to sample clients.
The final part addresses the most fundamental question clients need to ask themselves…why? Why even do financial planning? Why is money important? What are our fears and desires? Will accumulating a large portfolio actually lead to a more fulfilling life? What does being “rich” mean? Why should we care how much we leave at death?
Studies show that giving money to issues that are important to you, makes people feel richer than spending that on themselves. However, there are so many issues to choose from and different organizations to address them. The overwhelming selection of things to do with that money can be overwhelming. The last part hopes to stimulate some thoughts about your money’s potential impact. It’s impact to your family, to yourself, but also to society at large.
At WJ Interests, we help you move beyond traditional retirement planning to maximize your wealth and live out your goals. As a trusted resource in Sugar Land, TX, we’re here to guide you toward a confident, meaningful future and lasting legacy. Contact us today to explore how we can help you achieve your financial vision.
PAST PERFORMANCE IS NOT A GUARANTEE OF CURRENT OR FUTURE RESULTS. Examples of historical information included in this presentation do not, nor are they intended to, constitute a promise of similar future results. Specific client portfolio allocations, risks and returns can and may deviate from these examples depending on accounts and types of investments available through each account. Future market views by WJ Interests, LLC may vary significantly from the historical examples presented herein and no one receiving this summary should assume that WJ Interests, LLC will be able to replicate successful views in the future.


